Author: Tim Akerman

Tamarind Tree Consulting Ltd joins BSI
Tamarind Tree Consulting Ltd have joined the BSI organisation. As a business committed to improving the ease and effectiveness of ISO9001:2015 certification for SME’s it is a proud moment to be accepted as a member of the BSI organisation.
I felt it was important to be part of the BSI organisation to help promote quality and process excellence.


Case Study: Team Coaching in FMCG

I was invited by a close associate to work with him at a large FMCG manufacturer where he worked to help improve team performance. This team works in central services in an extremely large multinational corporation.
I arrived at the location on a Sunday evening and in the car journey to the hotel, my client advised that he wanted to change the focus of the development. Instead of working with the full team, I was to work with a smaller sub-team. My client advised that this sub-team was having particular problems with delivering their expected objectives. My revised task was to support the sub-team to identify what help was needed to develop their skills and improve overall performance. The sub team’s role is to approve new suppliers.
I created a team development workshop overnight and we started the next day looking at the team’s behaviours and output. We quickly identified several problems
- The process was inconsistent between team members
- The process was also inconsistently completed between departments.
- The team was governed through fear, carried over from a previous manager
- There were no measures of team performance
- The team was still working to a set of rules laid down by a former manager
The impact of these behaviours was that the staff were uncertain and working in constant fear. Failure to deliver was normal, all failures were blamed on people, and external demands were never challenged. This increased the workload in the department without adding value from the customer’s perspective. As a result, the team had become demotivated and disillusioned
I had two issues. The first was to understand and support the overall process. The second was to work with the individuals to help them improve their skills and resilience.
We employed three strategies to develop in parallel
- Focus on the process to identify and agree on the standard work.
- Work with the individuals to help them identify as a team and start collaborating
- Coach the individuals to enable them to understand their reactions and interact more positively
The strategies worked very well, by applying transformational coaching across the needs of the immediate client, recognising the demands of the wider organisation and the constraints individual team members perceived, we made huge step-change improvements in performance. The client (this team’s line manager) was coached to modify his behaviours to reflect the values agreed with the team. Individuals in the team were also coached to address their confidence and behavioural challenges. Working with the team, we were able to establish common values and establish the required process to enable the team to work effectively as a unit and in concert with other parts of the business. Since the process was developed by the team with support and guidance by me, they were fully engaged with the process.
After completing the intervention, the team identified that they needed to enforce the existing agreement and insist their customer, another internal department, upheld their part of the agreement. The team also stopped competing and arguing internally, focusing instead on solving problems at their root cause. The overall result was a reduction in workload and a higher quality of work product. The team also had higher engagement, morale, and created a positive and supportive working environment.
The work was so successful that further engagements were booked to deliver training and development with this team and with other teams in the business. A team build for another team in the department is planned for later in the year. I continue to coach the team director to support his development.

Do this one thing to speed up your culture change!
Culture change. It’s a huge and popular topic these days. There are so many departments that want to lead this area, human resources, change management, finance, organisational design, manufacturing, the list is as varied as the department names your business uses. Everyone tries their own strategy, but they all run into the same problem;
“Culture determines and limits strategy”
– Edgar H. Schein, Organizational Culture and Leadership, 1985
So why does culture keep reasserting itself, no matter how much well-meaning change management is brought in. Internal consultants, external consultants, charismatic leaders, servant leaders, there are more leadership models than you can shake a stick at. Yet still, the culture reasserts itself, it is pervasive and incredibly hard to change. Why?
Culture change efforts always focus on changing behaviours. It is right that behaviours must change, but with all these skilled people changing behaviours, why doesn’t the culture change?
Johnson and Scholes proposed a model of culture in their cultural web. There are many aspects to culture, and it is vitally important to connect each of the aspects of the cultural web to the values and beliefs required for our new culture.
One of the aspects of Johnson and Scholes cultural web that seems to be overlooked is Stories.
In every aspect of life, we tell stories, and these stories grow to be an oral history of the underlying “common sense” values and beliefs in the business. As change agents we work really hard to change behaviours, but how much effort do we put into changing the stories told? If we change behaviours to conflict with the stories in the business, we set new behaviours in conflict with the historical values and beliefs of the business. We start to hear comments such as “I know we aren’t supposed to say this, but…” or see the more experienced heads in the business purse their lips or shake their heads when new processes or behaviours are implemented. The old stories subside, but they don’t go away, they are instead told in quiet corners to select groups. The problem is the select groups overlap, so the story is still told as the history of the business, and the new behaviours are labelled as “the latest fad” and members are told to “just keep your head down and ride it out”. We create cliques and cabals to either protect our history or We can’t just suppress the old stories, and we can’t create new stories fast enough to displace the old values.
So what is the one thing that must be changed?
You can’t eliminate the story since it is part of the oral history of the business, so use it by changing the perspective of the story! Don’t just focus on changing behaviour, ensure the stories told in the business reflect the changing values and beliefs. Us the telling and retelling of the stories to change how the stories are interpreted and understood.
For example, if you have a hero culture and stories are told about how people have cut through bureaucracy to find solutions to past situations, just telling people not to tell the story won’t work. Telling people to obey the bureaucracy won’t work. Change the emphasis of the story to match the new belief system; add to the story, for example, add that whilst it was a brilliant outcome, highlight that there was a huge risk to the business from missing paperwork, and we were lucky to get away with it. When you get an example of the bureaucracy controlling the process and preventing an error, add a positive that using the bureaucracy has enabled the business to meet the customer needs. Once the change is embedded the story is changed forever. Reality hasn’t been changed, there is no deception, we have interpreted the old story in line with our new values. All the while we are telling new stories, stories that support the new values and beliefs.
In this way, we accelerate the culture change by adding new stories and modifying the interpretation of the old stories to match the modified cultures and beliefs embedded in the business. Be careful though, if you just tell people to interpret the story differently you will drive it into the shadows. The new interpretation must be through storytelling in collaboration with the people who guard the business beliefs and used to flush out conflicts between new and old values in a positive way for discussion and debate.
In summary, if you want to change the way your business behaves, change the stories that are told in and by the business both new and old.
What story will you change today?

New and improved coaching and mentoring

I have recently finished the classroom studies for ILM Level 7 Certificate in Executive Coaching and Mentoring. I have been coaching for about 15 years and decided this year it was time to invest in formal qualifications to back up the skills I have. Although I have been coaching for a long time, it is only recently that I have identified this as an important skillset and opportunity. I started doing small business mentoring with Boost about 2 years ago,and over the course of the last 2 years, I have been blessed with amazingly positive feedback. I then started helping a former colleague who was struggling to get his team to deliver on business objectives. Whilst helping him, he and his team identified that I was very good at coaching. I got comments such as “You really see people don’t you?”. Someone even commented that I was very good at this.
Having had this feedback I decided to go get some formal qualifications, after all, I had been doing it for many years it should not be too difficult. Then I had another thought. How much would I learn if I started with the view that I already knew all I needed to? So I revisited my thought process and decided to start assuming that I would learn new things. I am so glad I made the change in my viewpoint! I was blessed to work with an outstanding group and some great teachers. Along the way, I learned some new techniques that helped me to strengthen what I already know and some new tools that took me out of my comfort zone. These new tools are really important. One of the things I realised is that I am very good at coaching and mentoring people like me. I am not so sure I would be as good coaching and mentoring someone who was very different until now. The new tools were uncomfortable since they demanded that I engaged in a different way. Having got past my discomfort, I now feel much better equipped to help more people.
The outcome then is that I now have more tools available that can be
used to supplement and complement the tools I have been using for years.
What is coaching?
The way I define coaching is the activity of helping the client find the best solutions to their problems by asking them the questions they can’t think of or articulate, then supporting them to find their best answers.
What is Mentoring?
Mentoring is using the mentor’s knowledge and wisdom to guide the client to develop their own insights, knowledge and breakthroughs and from that create their own wisdom.

What next?
The next step for me is to continue learning and helping others. People often leave it too late to ask for help, meaning instead of coaching and mentoring to help them early on in their issue, they get caught in firefights and don’t make time to find help.
In case you are wondering why the pictures of buttons, these were a coaching tool that felt very uncomfortable until I understood it. One of the new tools uses buttons to help start meaningful conversations. This was something I would never have thought of.
The question you have to ask is could I be your button, the key that unlocks your potential and helps you become the best possible version of yourself. If I can, get in touch here

Tamarind Tree Consulting Ltd becomes Northern Powerhouse partner
Tamarind Tree Consulting Ltd is delighted to announce that it has joined the Northern Powerhouse Partner Programme. As a provider of training and productivity improvement support, Tamarind Tree Consulting Ltd is dedicated to supporting Northwest businesses to compete effectively. Deploying world class improvement and quality techniques, Tamarind tree Consulting Ltd can work in both service and manufacturing industries to improve output, capacity and quality.
Managing Director Tim Akerman said “The Northern Powerhouse initiative set out to support increasing productivity of northern manufacturing businesses. Tamarind Tree Consulting was set up with the same aim, so joining the Northern Powerhouse Partner Programme was a natural step forward. We are delighted to support this initiative and look forward to helping northern businesses improve productivity to become more competitive.”
Minister for the Northern Powerhouse, Jake Berry MP said:“I’m delighted to see another great northern business join our growing network of Northern Powerhouse Partners.
“Rebalancing the economy so it works for everyone is at the heart of our vision for the Northern Powerhouse so I’m excited to see the contribution Tamarind Tree Consulting will make as they support other growing businesses in the North to thrive and boost local economic growth.”

Don’t just move the average, understand the spread
Picture the scene; someone in your organisation comes up with a cost-saving idea. If we move the process mean to the lower limit, we can save £’000’s and still be in specification. The technical team doesn’t like it, but they can’t come up with a reason other than “it’ll cause problems”, the finance director loves the idea, and the production manager with one eye on costs says, well if we can save money and be in spec, what’s the problem?
Let me help you.
In this scenario, the technical team may be right. If we assume that your process is in control and produces items with a normal distribution (remember that is the best case scenario!) logic dictates that half of your data is below the average value and half is above. That being the case, what you really want to know is how far from the average the distribution spreads. If the spread is large and you change process to the extreme where the average value sits right on the customer specification limit, half of everything you make will be out of spec. Can you afford a 50% failure rate? What will the impact be on your customers, your reputation, your workload (dealing with complaints).
To work out how much we can move the process, we must first understand how much it varies, and we use a statistical value called the standard deviation to help us. Standard deviation is the average variation from the mean for a sample data set. To work it out, take 20 samples, measure them all 5 times then use a spreadsheet to work out the mean and standard deviation. If that is too much take 10 samples and measure 3 times. Keep in mind that the smaller sample size will give a larger standard deviation. Now take the mean and add 3 x standard deviation. This is the upper limit of your process spread. Subtract 3 x the standard deviation from the process mean to find the lower limit of your process spread. The difference between these two numbers is the spread of your process and will contain 99.7% of the results measured from the process output IF the process is in control and nothing changes.
If moving the mean takes the 3 standard deviation limits of your process outside of the specification, you will get complaints. It could be that the limits are already outside of the specification, in which case moving the average will make a bad situation worse.
It is possible to calculate the proportion of failures likely from a change of average, this done using z-score calculation. I’m not aiming to teach maths, so the important message is that the failure rate can be calculated.
This is the tip of the iceberg with understanding your process. If you don’t know that your process is stable and in control, the spread won’t help you because the process can jump erratically. To improve your process
1. Gain control, make sure the process is stable.
2. Eliminate errors and waste
3. Reduce variation
4. Monitor the process to make sure it stays that way.
The most significant and profitable gains are often from process stability, not from cost-cutting. All cost-cutting does is reduce the pain, think of cost-cutting as a painkiller when you have an infection. It makes it hurt less, but doesn’t stop the infection. You need to stop the infection to feel better.
Now do you want to hurt less or do you want to get better?
Why does variation and the type of variation matter?
Everything varies. We know it happens, and if you can’t see it, the variation may not be that significant to your process. However, it may be that your measurement systems are incapable of detecting significant variation that is important to your process, more about that in another post. Variation leads to production problems, waste and ultimately quality and delivery problems. Control the variation, you control the waste and costs. If waste and costs are a problem in your business, you may be interested in reading on.
There are two types of variation, common cause and special cause. Common cause variation is natural, characteristic of the process and most importantly, predictable. Special cause variation is caused by external factors acting on the process and is not predictable. This is an important distinction because the methodologies for investigating special and common cause variation are different, and if you investigate the wrong sort of variation it can waste a huge amount of time and cause frustration.
Take the process shown above. Just creating a graph of the data isn’t really useful, since it is unclear what should be investigated, or how to proceed. Typically a manager will look at a trend line to see if the process data is trending up or down. If the process is in control and (often) a manager observes an undesirable deviation from target, it is common to ask for that to be investigated. If the investigation focuses on special cause variation which is likely, since the investigator is likely to assume something is “wrong” therefore there must be a root cause. In businesses that do not use process control charts, there is no objective assessment of process performance before launching into seeking the root cause. The problem this creates is that there may not be a root cause. If common cause variation is at work, it is a fruitless exercise.
Where a root cause analysis finds nothing, managers can assume that the investigation is flawed and demand more work to identify the root cause. At this point willing workers are perplexed, nothing they look at can explain what they have seen. Eventually, the pressure leads to the willing worker picking the most likely “cause” and ascribing the failure to this cause. Success! The manager is happy and “corrective action” is taken. The problem is that system tampering will increase the variability in the system, making failures more likely.
The danger is then clear, if we investigate common cause variation using special cause techniques, we can increase variation through system tampering.
What then of the reverse, chasing common cause corrections for special cause variation. The basic performance of the process is unlikely to change, and every time there is a perceived “breakthrough” in performance, as soon as the special cause happens again the process exhibits more variation. The process does not see an increase in variation however, neither is there any improvement in the variation.
The only way to determine if the process is in control, or if a significant process change has occurred is to look at the data in a control chart. Using a control chart we can see which variation should be investigated as a special cause, and where we should seek variation reduction. In this example, the only result that should be investigated is result 8. This is a special cause and will have a specific reason. Eliminate the root cause of that and the process is in normal control. Everything else appears to be in control. Analysing the process data in this way leads to a focused investigation. If after removal of the special cause the process limits are inconsistent with the customer specification, variation reduction efforts should focus on common cause variation.
Why does the type of variation matter?
Everything varies. We know it happens, and if you can’t see it, the variation may not be that significant to your process. However, it may be that your measurement systems are incapable of detecting significant variation that is important to your process, more
There are two types of variation, common cause and special cause. Common cause variation is natural, characteristic of the process and most importantly, predictable. Special cause variation is caused by external factors acting on the process and is not predicable. This is an important distinction, because the methodologies for investigating special and common cause variation are different, and if you investigate the wrong sort of variation it can waste a huge amount of time and cause frustration.

Take the process shown above. Just creating a graph of the data isn’t really useful, since it is unclear what should be investigated, or how to proceed. Typically a manager will look at a trend line to see if the process data is
Where a root cause analysis finds nothing, managers can assume that the investigation is flawed and demand more work to identify the root cause. At this point willing workers are perplexed, nothing they look at can explain what they have seen. Eventually, the pressure leads to the willing worker picking the most likely “cause” and ascribing the failure to this cause. Success! The manager is happy and “corrective action” is taken. The problem is that system tampering will increase the variability in the system, making failures more likely.
The danger is then clear, if we investigate common cause variation using special cause techniques, we can increase variation through system tampering.
What then of the reverse, chasing common cause corrections for special cause variation. The basic performance of the process is unlikely to change, and every time there is a perceived “breakthrough” in performance, as soon as the special cause happens again the process exhibits more variation. The process does not see an increase in variation, however neither is there any improvement in the variation.

The only way to determine if the process is in control, or if a significant process change has occurred is to look at the data in a control chart. Using a control chart we can see which variation should be investigated as a special cause, and where we should seek variation reduction. In this example, the only result that should be investigated is result 8. This is a special cause and will have a specific reason. Eliminate the root cause of that and the process is in normal control. Everything else appears to be in control. Analysing the process data in this way leads to a focused investigation. If after removal of the special cause the process limits are inconsistent with the customer specification, variation reduction efforts should focus on common cause variation.
If you are interested in understanding more about variation and how it affects your process, please get in touch or visit me on stand C23 at the E3 Business Expo on 3rd April. Details can be found at https://www.1eventsmedia.co.uk/e3businessexpo/blog/2019/01/13/visitor-registrations-now-open-for-e3-business-expo-2019/
Where is the evidence for sigma shift?
This is a longer post than normal, since the topic is one that is debated and discussed wherever six sigma interacts with Lean and industrial engineering.
In lean six sigma and six sigma methodology there is a controversial little mechanism called sigma shift. Ask anyone who has been trained and they will tell you that all sigma ratings are given as short-term sigma ratings and that if you are using long term data you must add 1.5 to the sigma rating to get a true reflection of the process effectiveness. Ask where this 1.5 sigma shift comes from and you will be told with varying degrees of certainty that is has been evidenced by Motorola and industry in general. So should we just accept this?
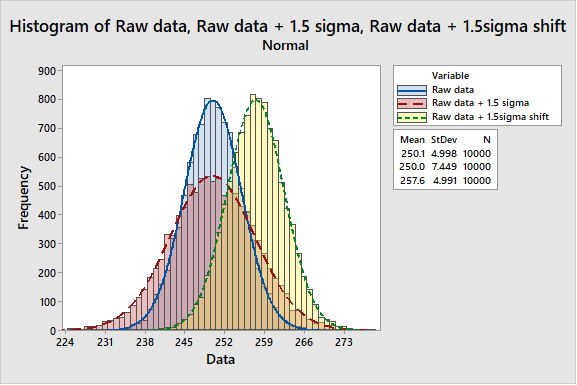
The argument is presented as a shift in the mean by up to 1.5 sigma as shown below.

Isn’t it strange in a discipline that is so exacting for evidence in so many aspects, this idea that the process sigma value must increase by 1.5 if you are using long term data is accepted without empirical evidence? The argument that Motorola or some other corporation has observed it, so it must be true sounds a lot like ‘We’ve always done it that way’. Suddenly this assertion doesn’t feel so comfortable does it? I set out to track down the source of this 1.5 sigma shift and find the source of the data, some study with actual data to prove the theory.
As soon as one starts to ask for data and search for studies, it becomes apparent that the data is not readily available to support this statement. Every paper referring to the 1.5 sigma shift seems to refer to it as ‘previous work’. Several studies came up consistently during my search.
- An article on tolerancing from 1962 by A. Bender (Bender, 1962)
- An article on statistical tolerancing by David Evans (Evans, 1975)
- An article on Six Sigma in Quality Progress from 1993 (McFadden, 1993)
- A treatise on the source of 1.5 sigma shift by Davis R. Bothe (Bothe, 2002)
So why am I focusing on these 4 citations? I perceive a migration across these papers from a simplified method of calculating cumulative tolerances to a theoretical explanation of where the 1.5 sigma shift comes from.
The first article in this series was written in 1962. At this time all calculations were done by hand, complex calculations with the aid of a slide rule. Mistakes were easy to make, and the process was time consuming. This was before electronic calculators, and before computers. Bender was seeking a shortcut to reduce the time taken to calculate tolerance stacks, whilst retaining some scientific basis for their calculation. The proposed solution was to use a fudge factor to arrive at a perceived practical tolerance limit. The fudge was to multiply the variance by 1.5, a figure based on “probability, approximation, and experience”. There is nothing wrong with this approach, however it cannot be called a data driven basis. It should also be understood that the purpose of the 1.5 sigma shift in this case was to provide a window for tolerancing that would give an acceptable engineering tolerance for manufactured parts.
The paper by Evans then provides a critical review of the methods available and uses the Bender example as a low technology method for setting tolerances that appears to work in that situation. One interesting comment in Evans paper is in his closing remarks
“Basic to tolerancing, as we have looked at it here as a science, is the need to have a well-defined, sufficiently accurate relationship between the values of the components and the response of the mechanism.”
Is there evidence that the relationship between the values of the components and the response of the mechanism is sufficiently well defined to use it as a basis for generalisation of tolerancing? I would argue that in most processes this is not the case. Commercial and manufacturing functions are eager to get an acceptable product to market, which is in most cases the correct response to market need. What most businesses fail to do thereafter is invest time, money and effort into understanding these causal relationships, until there is a problem. Once there is a problem, there is an expectation of instant understanding. In his concluding remarks Evans also notes that
“As for the other area discussed, the shifting and drifting of component distributions, there does not exist a good enough theory to provide practical answers in a sufficiently general manner.”
It seems then, that as of 1975 there was inadequate evidence to support the notion of 1.5 sigma shift.
The next paper identified, is an article by McFadden published in Quality Progress in 1993. In this article, MCfadden makes a strong mathematical case that when tolerancing, aiming for a Cp of 2 and Cpk of 1.5 yields a robust process. This is based upon a predicted shift in the process mean of 1.5σ. Under these circumstances, a defect rate of 3.4 defects per million opportunities would be achieved. Again, a sound mathematical analysis of a theoretical change, however there remains no evidence that it is real. Reference is made here to the paper by Bender.
The paper by Bothe, is very similar to the one by McFadden. Both papers express a view that there is evidence for this process shift somewhere, usually with Motorola sources quoted. The articles by Evans, McFadden, and Bothe are all referring to the case where the process mean shifts by up to 1.5 σ with no change in the standard deviation itself. Evans notes that there is no evidence this is a true case.
If you keep searching eventually you find an explanation of the source of 1.5 sigma shift from the author of Six Sigma itself, Mikel J. Harry. Harry addressed the issue of 1.5σ shift in his book Resolving the Mysteries of Six Sigma (Harry, 2003). On page 28 there is the most compelling evidence I have found for the origin of the 1.5σ shift. Harry states in his footnote
“Many practitioners that are fairly new to six sigma work are often erroneously informed that the proverbial “1.5σ shift factor” is a comprehensive empirical correction that should somehow be overlaid on active processes for purposes of “real time” capability reporting. In other words, some unjustifiably believe that the measurement of long-term performance is fully unwarranted (as it could be algebraically established). Although the “typical” shift factor will frequently tend toward 1.5σ (over the many heterogeneous CTQ’s within a relatively complex product or service), each CTQ will retain its ow unique magnitude of dynamic variance expansion (expressed in the form of an equivalent mean offset.”
This statement confirms that there is no comprehensive empirical evidence for the 1.5σ shift. Furthermore, Harry clearly states that the long-term behaviour of a process can only be established through long term study of that process. A perfectly reasonable assertion. There is another change here, in that Harry explains the 1.5 σ shift in terms of an increase in the standard deviation due to long term sampling variations, not as is often postulated in other texts, movements in the sample mean. Harry’s explanation is consistent with one of the central precepts of six sigma, namely that the sampling regime is representative. If the regime is representative, it is clear that the sample mean can vary only within the confidence interval associated with the sample. Any deviation beyond this would constitute a special cause since the process mean will have shifted, yielding a different process. The impact of different samples will be to yield an inflated standard deviation, not a shift of mean. This means that the 1.5sigma shift should be represented as below, not as a shift of the mean
In his book Harry expands on the six sigma methodology as a mechanism for setting tolerances and examining the capability of a process to meet those tolerances with a high degree of reproducibility in the long term. Much of the discussion in this section relates to setting of tolerances using a safety margin M=0.50 for setting of design tolerances.
It seems the 1.5σ shift is a best guess estimation of the long-term tolerances required to ensure compliance with specification. It is not, and never has been a profound evidence-based relationship between long term and short-term data sets. The source of this statement is none other than Mikel J. Harry, stated in his book and reproduced above. Harry has stated that
“…those of us at Motorola involved in the initial formulation of six sigma (1984 – 1985) decided to adopt and support the idea of a ‘1.5σ equivalent mean shift’ as a simplistic (but effective) way to account for the underlying influence of long-term, random sampling error.”
For me it is a significant coincidence that Bender proposed an estimating formula for tolerancing of processes based on 1.5 * √variance of x. Variance is a statistical term. It is defined as follows

The square root of variance is the standard deviation. Or put another way, we can estimate the likely behaviour over time of a process parameter using 1.5 sigma as the basis of variation to allow for shifts and drifts in the sampling of the process.
Given the dynamic nature of processes and process set-up, the methodology employed in process setting can greatly influence the observed result. For example if the process set up instruction requires the process to be inside specification before committing the run, then there may be genuine differences in the process mean. This will be far less likely if the process setup instruction requires the process to be on target with minimum variance.
It seems to me that the 1.5 sigma shift is a ‘Benderized tolerance’ based on ‘probability, approximation, and experience’. If tolerances are set on this basis, it is vital that the practitioner has knowledge and experience appropriate to justify and validate their assertion.

Harry refers to Bender’s research, citing this paper as a scientific basis for non-random shifts and drifts. The basis of Bender’s adjustment must be remembered – ‘probability, approximation and experience’. Two of these can be quantified and measured, what is unclear is how much of the adjustment is based on the nebulous parameter of experience.
In conclusion, it is clear that the 1.5 sigma shift quoted in almost every six sigma and lean six sigma course as a reliable estimate of long term shift and drift of a process is at best a reasonable guess based on a process safety margin of 0.50. Harry has stated in footnote 1 of his book
“While serving at Motorola, this author was kindly asked by Mr Robert ‘Bob’ Galvin not to publish the underlying theoretical constructs associated with the shift factor, as such ‘mystery’ helped to keep the idea of six sigma alive. He explained that such a mystery would ‘keep people talking about six-sigma in the many hallways of our company’.”
Given this information, I will continue to recommend that if a process improvement practitioner wishes to make design tolerance predictions then a 1.5 sigma shift is as good an estimate as any and at least has some basis in the process. However, if you want to know what the long-term process capability will be and how it compares to the short-term process capability, continue to collect data and analyse when you have both long and short term data. Otherwise, focus on process control, investigating and eliminating sources of special cause variation.
None of us can change where or how we are trained, nor can we be blamed for reasonably believing that which is presented as fact. The deliberate withholding of critical information to create mystery and debate demonstrates a key difference in the roots of six sigma compared to lean. Such disinformation does not respect the individual and promotes a clear delineation between the statisticians and scientists trained to understand the statistical basis of the data, and those chosen to implement the methodology. This deliberate act of those with knowledge withholding information, has created a fundamental misunderstanding of the methodology. Is it then any wonder that those who have worked diligently to learn, having been misinformed by the originators of the technique now propagate and defend this misinformation?
What does this mean for the much vaunted 3.4 DPMO for six sigma processes?
The argument for this level of defects is mathematically correct, however the validity of the value is brought into question when the objective evidence supporting the calculation is based in supposition not process data. I think it is an interesting mathematical calculation, but if you want to know how well your process meets the specification limits, the process capability indices Cp and Cpk are more useful. After all, we can make up any set of numbers and claim compliance if we are not concerned with data, facts and evidence.
This seems to be a triumph of management style over sense and reason, creating a waste of time and effort through debating something that has simply been taught incorrectly, initially through a conscious decision to withhold essential information, later through a failure to insist on data, evidence and proof.
However, if we continue to accept doctrine without evidence can we really regard ourselves and data driven scientists? Isn’t that the remit of blind faith? It is up to six sigma teachers and practitioners to now ensure this misinformation is corrected with all future teachings and to ensure that the 1.5 sigma shift is given its proper place as an approximation to ensure robust tolerances, not a proven process independent variation supported by robust process data.
Bibliography
Bender, A. (1962). Benderizing Tolerances – A Simple Practical Probability Method of Handling Tolerances for Limit-Stack-Ups. Graphic Science, 17.
Bothe, D. R. (2002). Statistical Reason for the 1.5σ Shift. Quality Engineering, 14(3), 479-487. Retrieved 2 22, 2018, from http://tandfonline.com/doi/full/10.1081/qen-120001884
Evans, D. H. (1975). Statistical Tolerancing: The State of the Art, Part III. Shifts and Drifts. Journal of Quality Technology, 72-76.
McFadden, F. (1993). Six Sigma Quality Programs. Quality Progress, 26(6).

I’m in the news!
Check out this article in Lancashire Business News.
https://businesslancashire.co.uk/2017/11/02/boost-helps-cheesecake-firm-get-just-desserts/
It’s great to have a satisfied customer, even better when they tell other companies how happy they are